How to Create KPI in Power View
KPIs are based on explicit calculated fields in the data model. In the Power View Field List, calculated fields have a calculator icon next to them. If the data model contains calculated fields, then you can use those fields to create KPIs in Power View.
You can add Key Performance Indicators (KPIs) to your Power View report to show progress toward goals.
Use a KPI in Power View
If the data model has KPIs, they’re easy to spot in the Field List. They have this icon next to them. You can use them in Power View sheets in Excel and in Power View in SharePoint.
The following are step-by-step instruction
- Create calculated fields for Actual and Target value
Create calculated field for Actual

Create calculated field for Target

2. Create KPI
- On a Power View sheet in Excel, on the Power Pivot tab > KPIs > New KPI.
- The KPI base field (value) box lists the calculated fields in the data model. Pick the one that contains the value you want to evaluate against a target.
- Define a target value. The target value can be:
- An absolute value – for example, 100.
- Another calculated field in the model – for example, a field containing sales quotas.
- Define the status thresholds and icon styles. You can define either three or five statuses for a KPI, depending on which status threshold and icon style you choose.
- Click OK and then Close.
- Click OK in the message that says you’ve changed the Data Model.

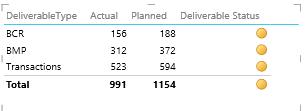
3. In Power View in the Field List, click the arrow next to the KPI.
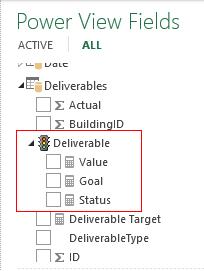
It expands to show the fields in the KPI:
- Value : Also called the base value, the calculated field that represents the current value for the item in that row of the table or matrix.
- Goal: Also called the target value, the value against which the current value is evaluated. This could be a fixed number, some goal all the rows should achieve, or a calculated field, which might have a different goal for each row.
- Status: The visual indicator of the value. In Power View in Excel, you can edit the KPI, choosing which indicators to use and what values to trigger each indicator.
Check the boxes you want to display